Translate this page into:
Bulk stiffness and recovery time – A measure of development of mouse embryos

*Corresponding author: Kunal D. Patil, Department of Design and Development, Spovum Technologies Private Limited, Bengaluru, Karnataka, India. kdp@spovum.com
-
Received: ,
Accepted: ,
How to cite this article: Patil KD, Kumar P, Bharadwaj K, Hegde S, Dharamkar S, Gupta B, et al. Bulk stiffness and recovery time – A measure of development of mouse embryos. J Reprod Healthc Med 2023;4:4.
Abstract
Objectives:
Understanding the onset of embryonic arrest by studying the morphology of the embryos at different stages of their development is a relatively well-understood subject. The qualitative nature of the study makes it difficult to determine and quantify the causes behind the arrest. For successful embryonic development, it is essential to know, non-destructively, and the developmental viability of the embryos at a particular stage.
Material and Methods:
We investigate the bulk stiffness and recovery time as the viability quantifiers for grading or classifying embryos at the two-cell stage or after the formation of the first cleavage. A simple cantilever beam-based experimental procedure is established to investigate two-cell mouse embryos in two distinct orientations.
Results:
Bulk stiffness measurement varies with the embryo’s orientation and deformation. A good quality two-cell embryo shows a significant decrease in stiffness ratio with the deformation. Also, the embryo’s recovery time after releasing deformation may indicate a quality-dependent correlation.
Conclusion:
Our study concludes that the bulk stiffness measurements in the two principal orientations, their ratio, and recovery time correlate with the underlying morphology of two-cell stage mouse embryos.
Keywords
Bulk stiffness
Embryo quality estimates
Assisted reproductive technology
Mechanical characterization of embryo
Morphomechanics
In vitro fertilization

INTRODUCTION
In the recent decade, assisted reproductive technology (ART) has advanced significantly, helping thousands of infertile couples to become parents. Controlled ovarian stimulation has improved oocyte recovery during ovum pickup; in vitro fertilization (IVF) and intracytoplasmic sperm injection (ICSI) have improved embryo formation. These embryos derived from the ART technique are subsequently graded. The embryo’s grade decides whether it is a good candidate for fresh or frozen embryo transfer. Grading embryos, together with the patient’s health, age, fertility, and medical history, help to determine the ideal day to transfer, the appropriate quantity of embryos to transfer, and precisely which embryos to transfer, resulting in greater pregnancy success rates. At present, the quality of the embryo is the most critical factor in determining its competence. Among the numerous invasive and non-invasive procedures, embryo selection based on morphology is an often used strategy today.[1-8] Selection strategy based on cumulative score may aid in improving implantation rates and preventing repeated or multiple gestations and complications over a single observation or “snapshot analysis.” Quantifying such cumulative measures and establishing inter-correlations among different parameters is an active area of work.[9,10]
It is well known that the mechanical properties of the oocytes and embryos show significant correlations to their underlying morphology.[11-18] Quality predictors based on mechanical properties can be employed quantitatively to identify viable or non-viable sub-populations of oocytes or during the early stage of embryogenesis. However, measuring mechanical properties accurately, reliably, and efficiently in a non-destructive manner are a challenge.[19-22] The mechanical properties of the cell are determined by the relationship between the degree of bulging and the applied negative pressure. Nanoindentation has lately gained popularity as a useful method for microscale mechanical measurements.[23] A micromachined multi-axis cellular force sensor is demonstrated for evaluating the mechanical properties of zona.[24] The sharp part of an injectable micropipette serves as the indentor tip. The use of a significantly less intrusive tip is employed in the works.[16,25] In the work,[26] on the basis of multilayer SU-8 technology, a simple technique is used to measure the elasticity of human oocytes. For decades, researchers have been studying the mechanical properties of oocytes and embryos. Various species, such as echinoderms, were involved,[27-30] amphibians,[31,32] bovines,[33] and even humans[26] are just a few examples. The mechanical characteristics of the preimplantation embryo are influenced by both the Zona pellucida and the mass inside. The oolemma and oocyte mechanical properties have also been shown to be an early indication of embryo quality. Mechanical properties of an oocyte’s cytoplasm and oolemma have been found to be accurate markers of oocyte maturity.[34-36]
The two-cell embryos are said to be placed in the H-configuration when two blastomere cells are positioned horizontally along the cantilever beam, and in the V-configuration, they are positioned vertically or stacked one above the other, perpendicular to the cantilever. Both the configuration together are referred to as the principal configurations. The bulk stiffness and recovery time are defined in the materials and methods section. A simple experimental procedure using the cantilever beam and oocyte holding pipette to exert force onto the embryos is established and used to investigate two-cell mouse embryos in two principal orientations.
In this study, we investigate non-destructively the applicability of the bulk stiffness measured in two principal orientations, their ratio, and the recovery time after deformation as the mechanical parameters for assessing the development potential viability of the morphologically viable and non-viable two-cell stage mouse embryos.
MATERIAL AND METHODS
Experimental set-up
The experimental set-up for evaluating embryos’ bulk stiffness and bulk recovery time consists of holding pipette (outer diameter 119 mm), Nunclon’s Petri dish with the two-cell mouse embryos placed within the drops of M2 medium, cantilever beams which are fixed at the bottom-center of the dish, Nikon eclipse TI-U Inverted microscope, and in-house video acquisition and recording system.
The cantilever beams having rectangular cross-sections are made up of silicone elastomer sheet (38 mm × 50 mm × 0.13 mm, E3146UUS, Eon Meditech, E = 1 MPa and n = 0.49), which are cut to the desired cantilever dimensions where L × h × width = 1.0 × 0.1 × 0.13 mm), using GCC Laser Pro (CO2 laser). Once the beams are cut, they are retrieved into the dish. The cantilever beams are immersed fully by adding ethanol to the dish. The dish is then wrapped in paraffin film to maintain sterility. Any extra furs or material stuck on the cantilevers due to the laser cutting is removed by sonication. Sonicator is filed with distilled water for ten cycles (480 s/cycle) at 60°C. After transferring to the Laminar air flow (LAF) enclosure for drying, Loctite glue is applied using a silicone applicator to the cantilever beams (rectangular pad location of the size 1 mm × 1mm × 0.13 mm) so that they can be fixed at the bottom-center portion of the Petri dish (3 beams/dish). Hot water cleaning is done to remove any alcohol remains. The cantilever beams and dish set-up are subjected to ultraviolet treatment and dried under LAF to maintain sterility. The cantilever beams are then fully submerged within the M2 medium drop (1 beam/drop) and prepared for the embryo’s bulk stiffness testing and recovery time measurements.
Mouse embryo collection, culture, and testing
Hundred ten ten-cell stage B6 albino strain mouse embryos (after 24 h of ICSI) are obtained from National Center for Biological Sciences, Bangalore, in the cryovials or straws (13–16 embryos/vial) under cryopreserved state. The mouse embryo thawing protocol consists of holding the vial in the air for 40 s and then plunging into 37°C water bath until ice removal from the straw. Once thawed, embryos are incubated in the sucrose medium diluent for 3–5 min, 37°C, until they shrink considerably and settle on the bottom of the dish. Then, the embryos are washed in the M2 media drop and transferred to the new drop of M2. The two-cell stage mouse embryos are transferred after thawing one by one to the dish containing M2 medium drop and positioned near the tip of the cantilever beam. The experiments are carried out in multiple batches (8–10 embryos/batch) to minimize outside exposure after thawing. The population consists of viable and non-viable embryos without identification done before cryopreservation. The quality of two-cell embryo samples varies from very good to completely degenerated states. This variation is crucial to establish any likely mechanomorphological correlation of the bulk stiffness and bulk recovery time to the morphology of the embryos at the two-cell stage.
Cantilever beam testing
The cantilever beam is glued at the bottom of the Petri dish and immersed within the M2 medium drop. Manufacturing of the cantilever beam introduces deviation in the prismatic cross-section profile across the length. It is then imperative to study the deviation of observed cantilever beam displacement by comparing it with the analytical solution obtained using Euler–Bernoulli (E-B) beam theory. Using E-B theory, we know that
where utip, L, b, and uc represent the tip-node displacement of the cantilever, the total length of the cantilever, the mean location of testing of the embryo from the cantilever tip, and the cantilever displacement at the mean location, respectively. In [Figure 1], we compared the displacement ratio uc/utip obtained using the analytical solution Eq. 1, and the displacement ratio derived from testing five different cantilever beams used for the experiments [Supplementary Index [SI] for an illustration]. The validity of Eq. 1 also shows that the cantilever beam stiffness kc remains constant during deformation. This observation also validates the critical slip conditions between the Petri dish and cantilever. The standard error is also shown for the experimentally measured values.

- Cantilever beam testing.
Embryo bulk stiffness measurement
The bulk stiffness of the embryo is defined as the total force required to cause unit compressive deformation of the embryo. It is a measure of a one-dimensional spring-like response under the influence of external mechanical loading of the embryo.[37,38] Two principal orientations at the two-cell stage of embryonic development are two configurational arrangements of the blastomeres with respect to the external loading and cantilever. In the H-configuration, the force of the deformation is shared equally between two blastomeres, and in the V-configuration, it is shared in series. As shown in [Figure 2], linear spring kc and standard linear viscoelastic solid element (ke, kv, ηv) model the cantilever and embryo, respectively, in series. Both springs ke and kv contribute to the deformation of the embryo. By gradual application of force with time, at equilibrium, dash-pot ηv dissipates the strain energy in the spring kv. By doing so, the force contribution from this arm decays. Thus, the resulting force in the viscoelastic element is only due to the spring ke. At time t, we have
where kc and ke represent the stiffness of the cantilever and bulk stiffness of the embryo, respectively, uc and ue represent the displacement of the cantilever (at the mean location of the embryo on the cantilever) and embryo, respectively, t = ηv/kv is the material time constant. As mentioned earlier, the second term in the viscoelastic contribution goes to zero at equilibrium. Thus, we can write
As discussed earlier, kc remains constant with the deformation of the cantilever. Determination of ue is carried out from successive images extracted from the recorded video of the experiment (SI for an illustration). Using Eq. 1, uc is evaluated by extracting the tip-node displacement of the cantilever. Stiffness of cantilever beam kc be found using
where E and I represent the elastic modulus and moment of inertia of the cantilever beam. All the experiments are conducted at ×10 optical zoom, and the visual geometry group (VGG) image annotation tool is used to get the relevant image pixel data for the displacement evaluation.
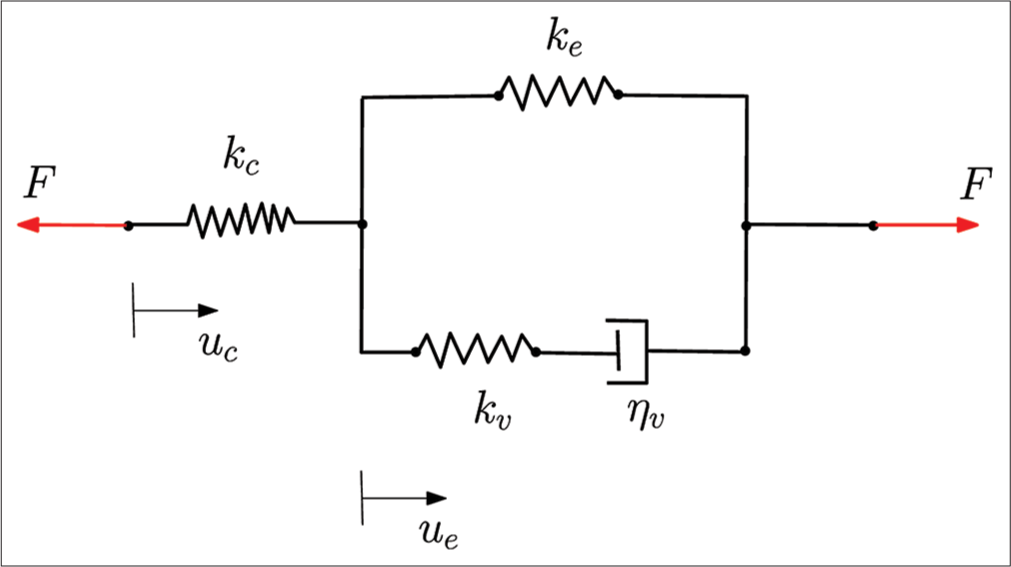
- Mechanical model of the embryo with cantilever.
Evaluation of bulk stiffness and recovery time of embryos
The mechanical experiment that we perform consists of two parts. The first part of the mechanical test consists of deforming the two-cell mouse embryos in two different configurations (H and V) using the holding pipette by pressing it against the cantilever beam. The load is applied gradually using the holding pipette such that the zona and two blastomeres undergo sufficient deformation. The cantilever beam also deforms by pressing the embryo against it. The material and geometric properties of the cantilever beam determine the resulting deflection magnitude. In the second part of the mechanical testing, the embryo is suddenly released from the deformed state. This process allows us to determine the overall or bulk recovery time. From the point of maximum embryo deformation (ue)max, the holding pipette is removed suddenly so that the embryos are released in the free state within the medium to recover their original dimensions. Bulk recovery time is defined as the time t taken by the embryo to recover deformation from 40% to 10% of the initial configuration. This measurement was carried out using the images extracted from the experimental videos. This choice of denition stems from the fact that all the embryos deform more than 40% from their initial configuration during the experiment, and mostly recover up to 90% of their original size in a reasonable amount of time. Any variation in the definition only shrinks or spreads the observed scattered distribution of embryos over time. Using the in-house recording set-up, the deformation and recovery processes are recorded at ×10 optical zoom. Post-experiments, the embryo’s deformation and recovery (H and V configurations) images are extracted, and the annotations are given using the VGG annotation tool to retrieve the relevant pixel data from the region of interest [SI for an illustration].
Morphological assessments for the two-cell mouse embryos
Evaluating the viability of two-cell stage mouse embryos by studying their morphology from an image data set is carried out by three embryologists [SI for an illustration]. Images of undeformed embryos were given for classification. A binary grading system is defined and used to classify embryo images as viable (assigned 1) and non-viable (assigned 0). All the viable embryos from the assessment are marked in red while plotting data. This broad classification helps to understand any overall correlation between the bulk stiffness, bulk recovery time, and associated morphology of mouse embryos at the two-cell stage.
Statistical test
For determining the significance of the observation that the proportion of viable embryos is clustered around non-viable embryos, a c2-test is used for evaluating the P-value. All the test requirements are satisfied, including no <5% observations in each group. More information about calculation is discussed in the SI.
RESULTS
Viable two-cell mouse embryos bulk stiffness and recovery time in the H-configuration
Figure 3a shows the bulk stiffness measurement set-up for the two-cell mouse embryos in the H configuration. Figure 3b shows the plot of the bulk stiffness obtained for embryos at the two-cell stage in H-configuration to the embryo’s deformation. Morphological assessment is first carried out for all the embryos, followed by grouping into viable (shown in red) and non-viable (shown in blue) categories. Viability here refers to the developmental potential of the embryos from a two-cell to a four-cell state. Observed data point values and calculated standard error for every embryo are plotted and interpolated at the mean value. Experiments are performed on a total of 83 embryos in H-configuration. In Figure 3c, a scatter of the bulk stiffness and deformation of 82 embryos is plotted against the corresponding bulk recovery time. Morphologically viable and non-viable embryos are shown in red and blue colors. For the embryo bulk stiffness experiments, cantilever beams do not deform more than 10%. This is because, as shown in Figure 1, the analytical solution derived using Eq. 1 shows a very good match at moderate cantilever deformation (between 10% and 20%). By observing Figure 3b and c, we assert (P = 0.008 < 0.05 based on 82 observations using c2-test, refer to SI for calculations) that the significant viable embryos cluster can be located between 0.02% and 0.06 N/m bulk stiffness, measured between 15% and 35% deformation, and 0.5–5 s recovery time.

- (a) Bulk stiffness in H-configuration (measured in N/m) with the percentage deformation and recovery time (in sec) of embryos; H-configuration of two-cell mouse embryo undergoing the bulk stiffness measurement. The holding pipette is used to push the embryo against the cantilever beam. (b) Scatter plot of H-configuration bulk stiffness measurements with the deformation of embryos which shows the deformation dependence of the bulk stiffness. Morphological quality assessment of the two-cell stage mouse embryos is superimposed on the data plots. (c) Three-dimensional scatter plot of H-configuration bulk stiffness with the deformation and recovery time of embryos to assess region of viable embryos data cluster using morphological quality assessment.
Viable two-cell mouse embryos bulk stiffness and recovery time in the V-configuration
Figure 4a shows the setup for measuring the bulk stiffness of embryos in V-configuration, where two blastomeres are stacked vertically, one above the other. Figure 4b shows the V configuration bulk stiffness measurements to the deformation of 58 embryos at two cell stages. Experiments are performed on a total of 83 embryos in V-configuration. Some embryos show significant blastomeres rotation while undergoing deformation; hence, the good quality observations in V-configuration are reduced to 58. In Figure 4c, the bulk stiffness and embryo deformation scatter for 55 embryos are plotted with the recovery time measured in the V-configuration setup. Imaging focus affected the recovery time measurements of four embryos. The scatter plot shows clustering of viable embryos between 0.02 and 0.1 N/m and 10–50% of deformation with 0.5–3 s recovery time (P = 0.0012 < 0.05 based on 54 observations using c2-test).

- (a) The bulk stiffness in V-configuration (measured in N/m) with the percentage deformation and recovery time (in sec) of embryos; V-configuration of the two-cell mouse embryo undergoing the bulk stiffness measurement. The holding pipette is used to push the embryo against the cantilever beam. (b) Scatter plot of V-configuration of the bulk stiffness measurements with the deformation of embryos which shows the deformation dependence of the bulk stiffness. Morphological quality assessment of the two-cell stage mouse embryos is superimposed on the data plots. (c) Three-dimensional scatter plot of V-configuration bulk stiffness with the deformation and recovery time of embryos to assess region of viable embryos data cluster using morphological quality assessment.
Viable two-cell mouse embryos bulk stiffness ratio and recovery time
In Figure 5a, the ratio of bulk stiffness (H/V configurations) obtained at the same percentage of deformation is plotted to the deformation of the embryo for a total of 39 embryos. Significantly fewer data points are observed because the bulk stiffness ratio has to be evaluated at the same percentage deformation such that the variation should not exceed ± 2.5% error. The scatter plot shows clustering of viable embryos between 0.2 and 1.0 and 10–35% of deformation with 0.5–4 s recovery time (P = 0.01 < 0.05 based on 39 observations using c2-test). A good quality two-cell embryo shows a significant stiffness ratio drop [Figure 5b].

- (a) The H/V-configuration bulk stiffness ratio with the embryo’s deformation. Each bulk stiffness ratio measurement is carried out at the same percentage of deformation. Morphological quality assessment of the two-cell stage mouse embryos is superimposed on the data plots. (b) Three-dimensional scatter plot of the bulk stiffness ratio with the deformation and recovery time of embryos to assess viable embryos data cluster using morphological quality assessment.
In Figure 6a, a 3d-scatter of the ratio of bulk stiffness (H/V configurations) obtained at the same percentage of deformation is plotted to the deformation of the embryo and relative size of the blastomeres measured to the overall size of the embryos in 2d image. The figure shows a total of 39 embryos. We observe two viable embryo clusters from Figure 6a and b, one below 35% and the other between 45% and 60%. As shown in Figure 6c, the bulk recovery time measurements in H-configuration are used to identify the difference between these two viable embryos cluster.

- (a) Three-dimensional scatter plot of the H/V-configuration bulk stiffness ratio with the embryo’s deformation and relative blastomeres size (total area of blastomeres/total area of the embryo). Each bulk stiffness ratio measurement is carried out at the same percentage of deformation and morphological quality assessment of the two-cell stage mouse embryos is superimposed on the data plots. (b) Two-dimensional plot of the bulk stiffness ratio with the relative blastomeres size showing viable and non-viable embryos cluster. (c) Two-dimensional plot of the bulk stiffness ratio with the recovery time. The plot shows three embryos that are classified as viable but have relatively small blastomeres area.
Thus, in summary, three primary observations of the embryos by performing mechanical testing of the embryos at the two-cell stage.
Bulk stiffness measurement depends on the embryo’s orientation during the experiment
Bulk stiffness increases (in some cases initially decreases) with an increase in the deformation of the embryo in both orientations
We can categorize results into three zones of early, intermediate, and late two-cell embryo recovery based on recovery time data.
DISCUSSION
Non-viable two-cell embryos show very low or high values of bulk stiffness at the corresponding % deformation. Furthermore, in the time recovery data and corresponding embryo recovery images, a rapid and delayed recovery indicates significant elastic stiffness and cytoplasmic degradation of the embryo, respectively. It is also observed that the bulk stiffness increases with the deformation of the embryo when zona and blastomeres start deforming together in both configurations. This phenomenon we term the deformation dependence of the bulk stiffness. In some cases, bulk stiffness drops at lower deformation and increases from moderate deformation. Two blastomeres are relatively small compared to the zona’s diameter in such cases. In the V-configuration setup, a significant increase in the bulk stiffness to the deformation indicates good-quality blastomeres.
The measured values of the embryo’s bulk stiffness are significantly influenced by measurement inaccuracies associated with the stiffness of the cantilever beam. The manufacturing and experimental environment may influence the cantilever beam’s material properties, residual stress, and geometry. To eliminate these effects, we must consider the ratio of H and V configurations’ bulk stiffnesses measured at the same percentage of the embryo’s deformation as a quantity of interest. From Figure 5a, the bulk stiffness ratio above 1.0 indicates that the stiffness is higher in the H-configuration than in the V-configuration measurement. Observing the morphology of the embryos at the moderate deformation, the ratio H/V >1 indicates either the deformation of the polar body along with zona and blastomeres in the H-configuration or abnormalities associated with the zona or blastomeres. The H/V ratio <0.4 indicates that the embryo is stiffer to deform in V configuration than in H-configuration. Morphologically, this observation is associated with significantly degenerated blastomeres. The cluster of non-viable embryos is observed around these extreme ratios. Morphologically, the bulk stiffness ratio H/V > 1 indicates relatively smaller blastomeres than the size of the zona, a very stiff zona, or degeneration of blastomeres into the spherical mass. Furthermore, the time recovery plot shows a cluster of non-viable embryos having recovery time greater than 8 s, attributed to the viscoplastic deformation of embryos. By observing Figure 5a and b, the magnitude of embryo bulk stiffness is relatively different in the V-configuration than H-configuration. This observation shows the anisotropy (different values to the principal orientations) in the bulk stiffness measurement. The existence of anisotropy in the measurement of bulk stiffness is mainly attributed to the geometry and mechanical properties of blastomeres, zona, and PV space. By observing Figure 6a and b, it is evident that the bulk stiffness ratio and its response show a significant correlation to the blastomere’s overall size. In Figure 6c, the bulk recovery time shows the further separation of overlapping observations.
It is argued in Estudillo et al.[39] that with cryopreservation, biochemical differences can be observed between cryopreserved and fresh oocytes and embryos. The study Giolo et al.[40] carried out on human oocytes observes no significant difference in the mechanical properties of healthy oocytes. In contrast, oocytes having dysmorphic characteristics show significant variations. It is also observed in Rienzi et al.[41] and Dalal et al.[42] that the outcome is not significantly affected between cryopreserved and fresh embryos. As the mechanical properties are strongly correlated to the underlying biochemical changes, in light of a few investigative studies, the mechanical properties, such as viscoplasticity and bulk stiffness, may change at the two-cell stage.
In previous studies,[11-15] various techniques have been used to estimate the mechanical properties of oocytes and zygotes. The aspiration-based method and atomic force microscopy (AFM) are widely known. The elastography technique[20] is a powerful technique to estimate mechanical properties accurately. We can classify oocyte or embryo mechanical properties measurement techniques broadly into two categories;
In situ measurements: Measurement involving “on the fly” setup, for example, aspiration-based, micro tactile sensor, and cellular force measurement technique
Ex situ measurements: Measurement involving separate lab setups, for example, AFM and elastography.
In both cases, mechanical manipulation of the oocyte or embryo is necessary. Our experience suggests that most IVF clinics prefer less complicated, cost-effective, and in situ measurement techniques with the least possible additional mechanical manipulation of oocytes or embryos. The aspiration-based method is simple as no additional manipulation is necessary, and the mechanical measurements are carried out using ICSI. Using the aspiration-based method, a mathematical model is necessary to predict mechanical properties at different stages of embryonic development. Although our experimental setup working principle is similar to the earlier work[15] on oocytes, the findings we list on the two-cell stage advocate that essential care must be taken in reporting bulk material properties. The main advantage of the cantilever-based technique is the extension to a double cantilever or microgripper setup and conducting of observations under time-lapse monitoring.
CONCLUSION
In summary, we observe that
A simple and non-destructive technique is developed to investigate morphomechanical correlations after the first embryonic cleavage-stage formation
Deformation dependence of the bulk stiffness is observed with the progressive deformation in both H and V configurations
The bulk stiffness of embryos at a two-cell stage varies with two principal orientations (H and V configurations)
Bulk stiffness in H and V configurations, their ratio, and bulk recovery time may be used as the quality predictors mainly for rejecting non-viable embryo clusters.
Ethics approval
IAEC approval statement is attached along with the manuscript.
Availability of data and materials
All the data supporting the present study’s findings are included in the manuscript. Some supplementary material that is deemed necessary is provided along with the manuscript in a supplementary index (SI) file.
Declaration of patient consent
Patient’s consent not required as there are no patients in this study.
Conflicts of interest
There are no conflicts of interest.
Financial support and sponsorship
Spovum Technologies Pvt. Ltd., Bangalore, India.
References
- Assessment of human embryo development using morphological criteria in an era of time-lapse, algorithms and “OMICS”: Is looking good still important? Mol Hum Reprod. 2016;22:704-18.
- [CrossRef] [PubMed] [Google Scholar]
- Intracytoplasmic sperm injection: Correlation of oocyte grade based on polar body, perivitelline space and cytoplasmic inclusions with fertilization rate and embryo quality. Hum Reprod. 1997;12:1750-5.
- [CrossRef] [PubMed] [Google Scholar]
- Updating the markers for oocyte quality evaluation: Intracellular temperature as a new index. Reprod Med Biol. 2018;17:434-41.
- [CrossRef] [PubMed] [Google Scholar]
- Selection of competent oocytes by morphological criteria for assisted reproductive technologies. Mol Reprod Dev. 2020;87:1021-36.
- [CrossRef] [PubMed] [Google Scholar]
- Dynamics of cytoplasm and cleavage divisions correlates with preimplantation embryo development. Reproduction. 2018;155:1-14.
- [CrossRef] [PubMed] [Google Scholar]
- Predictive value of oocyte morphology in human IVF: A systematic review of the literature. Hum Reprod Update. 2011;17:34-45.
- [CrossRef] [PubMed] [Google Scholar]
- Fertilization and early embryology: Does zona pellucida thickness influence the fertilization rate? Hum Reprod. 1995;10:1189-93.
- [CrossRef] [PubMed] [Google Scholar]
- Relationship between granular cytoplasm of oocytes and pregnancy outcome following intracytoplasmic sperm injection. Hum Reprod. 2000;15:2390-3.
- [CrossRef] [PubMed] [Google Scholar]
- Morphological and molecular markers are correlated with maturation-competence of human oocytes. Hum Reprod. 2013;28:2482-9.
- [CrossRef] [PubMed] [Google Scholar]
- Deep learning enables robust assessment and selection of human blastocysts after in vitro fertilization. NPJ Digit Med. 2019;2:21.
- [CrossRef] [PubMed] [Google Scholar]
- Estimating young's modulus of zona pellucida by micropipette aspiration in combination with theoretical models of ovum. J R Soc Interface. 2010;7:687-94.
- [CrossRef] [PubMed] [Google Scholar]
- Characterization of mechanical and biochemical properties of developing embryonic tendon. Proc Natl Acad Sci U S A. 2013;110:6370-5.
- [CrossRef] [PubMed] [Google Scholar]
- Investigating the mechanical properties of zona pellucida of whole human oocytes by atomic force spectroscopy. Integr Biol (Camb). 2016;8:886-93.
- [CrossRef] [PubMed] [Google Scholar]
- Human oocyte developmental potential is predicted by mechanical properties within hours after fertilization. Nat Commun. 2016;7:10809.
- [CrossRef] [PubMed] [Google Scholar]
- In situ mechanical characterization of mouse oocytes using a cell holding device. Lab Chip. 2010;10:2154-61.
- [CrossRef] [PubMed] [Google Scholar]
- Mouse zona pellucida dynamically changes its elasticity during oocyte maturation, fertilization and early embryo development. Hum Cell. 2006;19:119-25.
- [CrossRef] [PubMed] [Google Scholar]
- Mechanics of mouse blastocyst hatching revealed by a hydrogel-based microdeformation assay. Proc Natl Acad Sci. 2018;115:10375-380.
- [CrossRef] [PubMed] [Google Scholar]
- Contribution of cytoplasm viscoelastic properties to mitotic spindle positioning. Proc Natl Acad Sci U S A. 2022;119:e2115593119.
- [CrossRef] [PubMed] [Google Scholar]
- Elasticity measurement of zona pellucida using a micro tactile sensor to evaluate embryo quality. J Mamm Ova Res. 2008;25:8-16.
- [CrossRef] [Google Scholar]
- Ultrafast imaging of cell elasticity with optical microelastography. Proc Natl Acad Sci. 2018;115:861-6.
- [CrossRef] [PubMed] [Google Scholar]
- Bulk elastic properties of chicken embryos during somitogenesis. Biomed Eng Online. 2010;9:19.
- [CrossRef] [PubMed] [Google Scholar]
- The bulk elastic modulus and the reversible properties of cell walls in developing Quercus leaves. Plant Cell Physiol. 2006;47:715-25.
- [CrossRef] [PubMed] [Google Scholar]
- Mechanical property characterization of mouse zona pellucida. IEEE Trans Nanobiosci. 2003;2:279-86.
- [CrossRef] [PubMed] [Google Scholar]
- Micro-mechanical sensing platform for the characterization of the elastic properties of the ovum via uniaxial measurement. J Biomech. 2004;37:67-72.
- [CrossRef] [PubMed] [Google Scholar]
- Measuring the mechanical behaviour of human oocytes with a very simple su-8 micro-tool. Biomed Microdevices. 2008;10:411-9.
- [CrossRef] [PubMed] [Google Scholar]
- The mechanical properties of the cell surface: Iii. The sea-urchin egg from fertilization to cleavage. J Exp Biol. 1955;32:734-50.
- [CrossRef] [Google Scholar]
- Regional difference in mechanical properties of the cell surface in dividing echinoderm eggs*. Dev Growth Differ. 1985;27:371-83.
- [CrossRef] [PubMed] [Google Scholar]
- Tension at the surface of the dividing sea-urchin egg. J Exp Biol. 1972;57:575-87.
- [CrossRef] [PubMed] [Google Scholar]
- The mechanism of cell division in the cleavage of the newt's egg. J Exp Biol. 1955;32:700-33.
- [CrossRef] [Google Scholar]
- Wave of stiffness propagating along the surface of the newt egg during cleavage. J Cell Biol. 1974;60:1-7.
- [CrossRef] [PubMed] [Google Scholar]
- Fabrication of micro tactile sensor for the measurement of micro-scale local elasticity. Sens Actuators A Phys. 2004;109:202-7.
- [CrossRef] [Google Scholar]
- Selection based on morphological assessment of oocytes and embryos at different stages of preimplantation development: A review. Hum Reprod Update. 2003;9:251-62.
- [CrossRef] [PubMed] [Google Scholar]
- Characterization of the injection funnel during intracytoplasmic sperm injection reflects cytoplasmic maturity of the oocyte. Fertil Steril. 2016;106:1101-6.
- [CrossRef] [PubMed] [Google Scholar]
- Microfluidic analysis of oocyte and embryo biomechanical properties to improve outcomes in assisted reproductive technologies. Mol Hum Reprod. 2017;23:235-47.
- [CrossRef] [PubMed] [Google Scholar]
- Evaluating Bulk Stiffness of mcf-7 Cells using Micro-scale Composite Compliant Mechanisms In: International and National Conference on Machines and Mechanisms (iNacoMM). 2013.
- [Google Scholar]
- Micro-scale composite compliant mechanisms for evaluating the bulk stiffness of mcf-7 cells. Mech Mach Theory. 2015;91:258-68.
- [CrossRef] [Google Scholar]
- Cryopreservation of gametes and embryos and their molecular changes. Int J Mol Sci. 2021;22:10864.
- [CrossRef] [PubMed] [Google Scholar]
- Study of the mechanical properties of fresh and cryopreserved individual human oocytes. Eur Biophys J. 2019;48:585-92.
- [CrossRef] [PubMed] [Google Scholar]
- Embryo development of fresh “versus” vitrified metaphase ii oocytes after ICSI: A prospective randomized sibling-oocyte study. Hum Reprod. 2010;25:66-73.
- [CrossRef] [PubMed] [Google Scholar]
- A retrospective analysis of outcome of vitrified vs fresh oocytes among donor and patient cohorts. Int J Infertil Fetal Med. 2021;12:1-6.
- [CrossRef] [Google Scholar]
SUPPLEMENTARY INDEX (SI)
MATERIALS AND METHODS
Cantilever beam testing
Figure S1 shows the cantilever beams used during the embryo deformation experiments. Initial and deformed configurations are superimposed so that displacement measurements are carried out to generate [Figure 1] in the main article.

- Cantilever beams used in the experiments at ×4 magnification.
Figure S2 illustrates the method of generating displacement ratio data points (experiments) in Figure 1 of the main article. Pixel data related to points 1,2,3, and 4 is extracted using the open-source VGG annotation tool. The displacement ratio gives a typical experimental data point in [Figure 1]. Other geometric data L and b are also extracted from these images and substituted in the analytical formula Eq. 1.

- Visual geometry group annotation tool to extract the cantilever beam displacement data.
Bulk stiffness measurement
Figures S3 and S4 illustrate the procedure to extract the embryo and cantilever beam deformation data from the successive images at steady-state deformations. For this typical case, four images are shown with the point data annotation carried out using the visual geometry group (VGG) tool. The points 1 and 3-pixel data from the first and fourth figure panels are used to extract initial and final deformations. The point 5-pixel data from the first and fourth figure panels are used to calculate the cantilever tip-deformation. The points 3 and 5-pixel data from the second figure panel are used to calculate position b, which is then substituted in Eqns. 1 and 4.

- Two-cell embryo bulk stiffness measurement in H-configuration.

- Two-cell embryo bulk stiffness measurement in V-configuration.
Recovery time measurement
Figures S5 and S6 illustrate the procedure to extract the embryo recovery data from the successive images. For this typical case, six images are shown with the point data annotation carried out using the VGG tool. The points 1 and 2-pixel data from the first figure panel are used to extract the initial configuration or total diameter. Subsequent images give the recovery data (images are extracted at 4 fps). As there is no significant difference in the recovery time in both H and V configurations, we use H-configuration time recovery data.

- Two-cell embryo recovery time in H-configuration (viable embryo example).

- Two-cell embryo recovery time in V-configuration (degenerated case example).
Morphological assessment
Morphological assessment of 110, two-cell mouse embryos, is carried out by three embryologists. The images and corresponding assessment are attached below. The following lists of embryo assessments are used to superimpose corresponding figures. Viable and non-viable embryo data are shown in red and blue colors, respectively. Embryo samples vary from excellent quality to completely degenerated cases.
H-configuration embryos in Figure 1b: 5–11, 19–23, 37– 51, 53–90, 92–102, 104–110 (total 83) H-configuration embryos in Figure 1c: 5–11, 19–23, 37– 51, 53–85, 87–90, 92–102, 104–110 (total 82) V-configuration embryos in Figure 2b: 5–13, 19–26, 37, 44, 55, 56, 58, 59, 63, 65, 67–70, 73, 77, 81, 84–87, 89, 91–93, 95–97, 102, 103, 106, 107, 109 (total 58) V-configuration embryos in Figure 2c: 5–13, 20–36, 37, 44, 55, 56, 58, 59, 63, 65, 67–70, 73, 77, 84, 85, 87, 89, 91–93, 95–97, 102, 103, 106, 107, 109 (total 55) H/V-configuration embryos in Figure 3a: 5–11, 19–23, 37, 44, 55, 56, 58, 59, 63, 65, 67–70, 73, 77, 81, 84, 85, 87, 89, 92, 93, 95–97, 102, 106, 107, 109 (total 39) H/V-configuration embryos in Figure 3b: 5–11, 19–23, 37, 44, 55, 56, 58, 59, 63, 65, 67–70, 73, 77, 81, 84, 85, 87, 89, 92, 93, 95–97, 102, 106, 107, 109 (total 39)
Morphological assessment criteria
Three expert embryologists followed the following morphological assessment protocol in assessing two-cell embryo images and categorized them into binary classifications as viable and non-viable. Here, viability refers to the ability of two-cell embryos to continue along embryogenesis and progress into four cells. Non-viability indicates degeneration of the embryo.
Statistical tests
Total embryos tested: 110 (viable: 64 and non-viable 46) Measurement in H-configuration:
Total embryos tested: 82 Total viable embryos: 43 Total non-viable embryos: 39 Zone of interest: viable embryos between 0.02 and 0.06 N/m bulk stiffness, 15–35% deformation, and 0.5–5 s recovery time. The Chi-square statistic is 6.8457. P-value is 0.008886. Significant at P < 0.05 The Chi-square statistic with Yates correction is 5.7217. P-value is 0.016757. Significant at P < 0.05. Measurement in V-configuration:
Total embryos tested: 54 Total viable embryos: 17 Total non-viable embryos: 37 Zone of interest: viable embryos between 0.02 and 0.1 N/m bulk stiffness, and 10–50% deformation, and 0.5–3 s recovery time. The Chi-square statistic is 10.4905. P-value is 0.0012. Significant at P < 0.05 The Chi-square statistic with Yates correction is 8.6341. P-value is 0.003299. Significant at P < 0.05 Measurement H/V:
Total embryos tested: 39 Total viable embryos: 17 Total non-viable embryos: 22 Zone of interest: viable embryos between 0.2 and 1.0 ratio, and 10–35% deformation, and 0.5–4 s recovery time. The Chi-square statistic is 5.7696. P-value is 0.016306. Significant at P < 0.05 The Chi-square statistic with Yates correction is 4.3221. P-value is 0.03762. Significant at P < 0.05 The Fisher exact test statistic value is 0.0248. The result is significant at P < 0.05.
No
Zone inside
Zone outside
Viable
31
17
Non-viable
12
22
No
Zone inside
Zone outside
Viable
12
9
Non-Viable
5
28
No
Zone inside
Zone outside
Viable
12
7
Non-viable
5
15
Embryo images

| Embryo name # | position H | position V | Zona | PVS | Blastomere 1 | Blastomere 2 | Blastomere cell membrane | Developing potential to 4 cell | Comment |
|---|---|---|---|---|---|---|---|---|---|
| 0=Non-viable; 1=Viable | Zona, blastomere 1, blastomere 2, blastomere cell membrane, PVS etc. | ||||||||
| E_1 | Yes | Yes | Normal | Large | Degenerated | Degenerated | Not intact | 0 | |
| E_2 | Yes | Yes | Normal | Large | Degenerated | Degenerated | Not intact | 0 | |
| E_3 | Yes | Yes | Normal | Large | Degenerated | Degenerated | Not intact | 0 | Fragments in PVS |
| E_4 | Yes | Yes | Normal | Large | Degenerated | Degenerated | Not intact | 0 | |
| E_5 | Yes | Yes | Normal | Large | Degenerated | Degenerated | Not intact | 0 | Fragments in PVS |
| E_6 | Yes | Yes | Normal | Large | Degenerated | Degenerated | Not intact | 0 | |
| E_7 | Yes | Yes | Normal | Large | Degenerated | Degenerated | Not intact | 0 | Blastomeres |
| are not clear | |||||||||
| E_8 | Yes | Yes | Normal | Large | Degenerated | Degenerated | Not intact | 0 | Fragments in PVS |
| E_9 | Yes | Yes | Normal | Large | Degenerated | Degenerated | Not intact | 0 | Fragments in PVS |
| E_10 | Yes | Yes | Normal | Large | Degenerated | Degenerated | Not intact | 0 | |
| E_11 | Yes | Yes | Normal | Large | Degenerated | Degenerated | Not intact | 0 | Blastomeres |
| are not clear | |||||||||
| E_12 | Yes | Yes | Normal | Large | Degenerated | Degenerated | Not intact | 0 | |
| E_13 | Yes | Yes | Normal | Large | Degenerated | Degenerated | Not intact | 0 | Blastomeres |
| are not clear | |||||||||
| E_14 | Yes | Yes | Normal | Large | Degenerated | Degenerated | Not intact | 0 | Blastomeres are not clear, multiple inclusions in PVS |
| E_15 | Yes | Yes | Normal | Large | Degenerated | Degenerated | Not intact | 0 | Blastomeres are not clear, multiple inclusions in PVS |
| E_16 | Yes | Yes | Normal | Large | Degenerated | Degenerated | Not intact | 0 | Blastomeres |
| are not clear | |||||||||
| E_17 | Yes | Yes | Normal | Large | Degenerated | Degenerated | Not intact | 0 | Blastomeres |
| are not clear | |||||||||
| E_18 | Yes | Yes | Normal | Large | Degenerated | Degenerated | Not intact | 0 | Blastomeres |
| are not clear | |||||||||
| E_19 | Yes | Yes | Normal | Large | Degenerated | Degenerated | Not intact | 0 | Blastomeres |
| are not clear | |||||||||
| E_20 | Yes | Yes | Normal | Large | Degenerated | Degenerated | Not intact | 0 | Fragments in PVS |
| E_21 | Yes | Yes | Normal | Large | Degenerated | Degenerated | Not intact | 0 | |
| E_22 | Yes | Yes | Normal | Large | Degenerated | Degenerated | Not intact | 0 | |
| E_23 | Yes | Yes | Normal | Large | Degenerated | Degenerated | Not intact | 0 | |
| E_24 | Yes | Yes | Normal | Large | Degenerated | Degenerated | Not intact | 0 | Blastomeres are not clear |
| E_25 | Yes | Yes | Normal | Large | Degenerated | Degenerated | Not intact | 0 | Blastomeres are not clear |
| E_26 | Yes | Yes | Normal | Large | Degenerated | Degenerated | Not intact | 0 | |
| E_27 | Yes | Yes | Normal | Large | Degenerated | Degenerated | Not intact | 0 | |
| E_28 | Yes | Yes | Normal | Large | Degenerated | Degenerated | Not intact | 0 | |
| E_29 | Yes | Yes | Normal | Large | Degenerated | Degenerated | Not intact | 0 | Blastomeres are not clear |
| E_30 | Yes | Yes | Normal | Large | Degenerated | Degenerated | Not intact | 0 | |
| E_31 | Yes | Yes | Normal | Large | Shrink | Shrink | Intact | 0 | |
| E_32 | Yes | Yes | Normal | Large | Degenerated | Degenerated | Not intact | 0 | Blastomeres are not clear |
| E_33 | Yes | Yes | Normal | Large | Shrink | Shrink | Intact | 0 | |
| E_34 | Yes | Yes | Normal | Large | Degenerated | Degenerated | Not intact | 0 | |
| E_35 | Yes | Yes | Normal | Large | Degenerated | Degenerated | Not intact | 0 | |
| E_36 | Yes | Yes | Normal | Large | Degenerated | Degenerated | Not intact | 0 | |
| E_37 | Yes | Yes | Normal | Normal | Normal | Normal | Intact | 1 | Fragments in PVS |
| E_38 | Yes | No | Normal | Normal | Normal | Normal | Intact | 1 | |
| E_39 | Yes | No | Normal | Normal | Normal | Normal | Intact | 1 | |
| E_40 | Yes | No | Normal | Normal | Normal | Normal | Intact | 1 | |
| E_41 | Yes | No | Normal | Normal | Normal | Normal | Intact | 1 | |
| E_42 | Yes | No | Normal | Normal | Normal | Normal | Intact | 1 | Fragments in PVS |
| E_43 | Yes | No | Normal | Normal | Normal | Normal | Intact | 1 | Fragments in PVS |
| E_44 | Yes | Yes | Normal | Normal | Normal | Normal | Intact | 1 | |
| E_45 | Yes | No | Normal | Large | Shrink | Shrink | Intact | 0 | |
| E_46 | Yes | No | Normal | Normal | Normal | Normal | Intact | 1 | |
| E_47 | Yes | No | Normal | Normal | Normal | Normal | Intact | 1 | |
| E_48 | Yes | No | Normal | Normal | Normal | Normal | Intact | 1 | |
| E_49 | Yes | No | Normal | Normal | Normal | Normal | Intact | 1 | |
| E_50 | Yes | No | Normal | Large | Degenerated | Degenerated | Not intact | 0 | |
| E_51 | Yes | No | Normal | Large | Degenerated | Normal | Partially intact | 0 | |
| E_52 | Yes | No | Normal | Normal | Normal | - | Intact | 1 | 1 cell |
| E_53 | Yes | No | Normal | Large | Shrink | Shrink | Intact | 0 | |
| E_54 | Yes | No | Normal | Normal | Normal | Normal | Intact | 1 | |
| E_55 | Yes | Yes | Normal | Normal | Normal | Normal | Intact | 1 | Central granulation |
| E_56 | Yes | Yes | Normal | Normal | Normal | Normal | Intact | 1 | Central granulation |
| E_57 | Yes | No | Normal | Large | Shrink | Shrink | Intact | 0 | |
| E_58 | Yes | Yes | Normal | Normal | Normal | Normal | Intact | 1 | |
| E_59 | Yes | Yes | Normal | Large | Degenerated | Normal | Partially intact | 0 | |
| E_60 | Yes | No | Normal | Normal | Normal | Normal | Intact | 1 | |
| E_61 | Yes | No | Normal | Large | Degenerated | Normal | Partially intact | 0 | |
| E_62 | Yes | No | Normal | Normal | Normal | Normal | Intact | 1 | |
| E_63 | Yes | Yes | Normal | Normal | Normal | Normal | Intact | 1 | |
| E_64 | Yes | No | Normal | Normal | Normal | Normal | Intact | 1 | |
| E_65 | Yes | Yes | Normal | Normal | Normal | Normal | Intact | 1 | |
| E_66 | Yes | No | Normal | Normal | Degenerated | Normal | Intact | 1 | |
| E_67 | Yes | Yes | Normal | Normal | Normal | Normal | Intact | 1 | |
| E_68 | Yes | Yes | Normal | Normal | Normal | Normal | Intact | 1 | |
| E_69 | Yes | Yes | Normal | Normal | Normal | Normal | Intact | 1 | |
| E_70 | Yes | Yes | Normal | Normal | Normal | Normal | Intact | 1 | |
| E_71 | Yes | No | Normal | Normal | Normal | Normal | Intact | 1 | |
| E_72 | Yes | No | Normal | Normal | Normal | Normal | Intact | 1 | |
| E_73 | Yes | Yes | Normal | Normal | Degenerated | Normal | Partially intact | 0 | |
| E_74 | Yes | No | Normal | Normal | Normal | Normal | Intact | 1 | |
| E_75 | Yes | No | Normal | Normal | Normal | Normal | Intact | 1 | |
| E_76 | Yes | No | Normal | Normal | Normal | Normal | Intact | 1 | |
| E_77 | Yes | Yes | Normal | Normal | Normal | Normal | Intact | 1 | |
| E_78 | Yes | No | Normal | Normal | Degenerating | Normal | Partially degenerating | 1 | |
| E_79 | Yes | No | Normal | Normal | Degenerated | Normal | Partially intact | 0 | |
| E_80 | Yes | No | Normal | Large | Degenerated | Degenerated | Not intact | 0 | |
| E_81 | Yes | Yes | Normal | Large | Normal | Normal | Intact | 1 | |
| E_82 | Yes | No | Normal | Normal | Normal | Normal | Intact | 1 | |
| E_83 | Yes | No | Normal | Large | Shrink | Shrink | Intact | 0 | |
| E_84 | Yes | Yes | Normal | Large | Shrink | Shrink | Intact | 0 | |
| E_85 | Yes | Yes | Normal | Large | Shrink | Shrink | Intact | 0 | |
| E_86 | Yes | Yes | Uneven | large | Normal | Normal | Uneven | 1 | |
| E_87 | Yes | Yes | Normal | Large | Shrink | Shrink | Intact | 0 | |
| E_88 | Yes | No | Normal | Normal | Normal | Normal | Intact | 1 | |
| E_89 | Yes | Yes | Normal | Normal | Normal | Normal | Intact | 1 | |
| E_90 | Yes | No | Normal | Normal | Normal | Irregular | Intact | 1 | |
| E_91 | No | Yes | Normal | Normal | Intact | Intact | Intact | 1 | |
| E_92 | Yes | Yes | Normal | Normal | Normal | Normal | Intact | 1 | |
| E_93 | Yes | Yes | Normal | Large | Shrink | Shrink | Intact | 0 | |
| E_94 | Yes | No | Normal | Large | Shrink | Shrink | Intact | 0 | |
| E_95 | Yes | Yes | Normal | Large | Shrink | Shrink | Intact | 0 | |
| E_96 | Yes | Yes | Normal | Large | Shrink | Shrink | Intact | 0 | |
| E_97 | Yes | Yes | Normal | Large | Shrink | Shrink | Intact | 0 | |
| E_98 | Yes | No | Normal | Normal | Normal | Normal | Intact | 1 | |
| E_99 | Yes | No | Normal | Large | Shrink | Shrink | Intact | 0 | |
| E_100 | Yes | No | Normal | Large | Shrink | Shrink | Intact | 0 | |
| E_101 | Yes | No | Normal | Large | Shrink | Shrink | Intact | 0 | |
| E_102 | Yes | Yes | Normal | Large | Shrink | Shrink | Intact | 0 | |
| E_103 | No | Yes | Normal | Normal | Intact | Intact | intact | 1 | |
| E_104 | Yes | No | Normal | Normal | Normal | Normal | Intact | 1 | |
| E_105 | Yes | No | Normal | Large | Shrink | Shrink | Intact | 0 | Blastomeres are seperated |
| E_106 | Yes | Yes | Normal | Normal | Normal | Normal | Intact | 1 | |
| E_107 | Yes | Yes | Normal | Large | Shrink | Shrink | Irregular | 0 | |
| E_108 | Yes | No | Normal | Large | Shrink | Shrink | Intact | 0 | |
| E_109 | Yes | Yes | Normal | Large | Shrink | Shrink | Intact | 0 | |
| E_110 | Yes | No | Normal | Large | Shrink | Shrink | Intact | 0 |
PVS: Perivitelline space